Re-visualizing Explanations for AI Systems

Master Thesis
Project Overview
In this digital age we are surrounded by algorithms that provide us with recommendations on things like what to watch, what to buy, and what to eat. The problem is that these algorithms don't really explain why you get these recommendations which might make it hard to trust them and utilize their potential. In the current state-of-the art research, tools exist for generating such explanations ... but their output is hard to understand and not very user-friendly. For my masters thesis I systematically investigated how these tools could be re-visualized to improve understandability so that designers can start using these explainable AI (XAI) tools in consumer recommender systems.
My Contribution
Although I was in charge of the project, my supervisors acted as mentors and stakeholders. As mentors they provided me with valuable feedback on my thesis. As stakeholders, they had a number of demands because this project was part of my PhD supervisors work. During implementation, my PhD supervisor created the package for generating explainable AI (XAI) visualizations while I created the XAI systems and the online study.
An explainable artifical intelligence music recommender user interface
The XAI music system. The interface consists of the current trial number (top), prediction along with the explanation and song preview (middle left), feature descriptions (middle right), and a reccurent question on user understanding (bottom).
IDEATE
Background
In XAI tools, we noticed that when explanations had multiple negations, they were quite difficult to understand. Although this was a new observation in XAI, linguistics literature shows that sentences with double negations are not very comprehensible. In fact, according to cognitive psychology theories, positive information is easier to mentally process. With the gap in XAI and these insights in other fields, we systematically investigated how framing influences understandability in XAI tools.
Research Questions
RQ1: How do feature explanations containing underlying continuous variables influence the ability to understand explanations?
RQ2: How does a framed visualization with feature explanations and it valence alignment with the final prediction, influence the ability to understand explanations?
Process
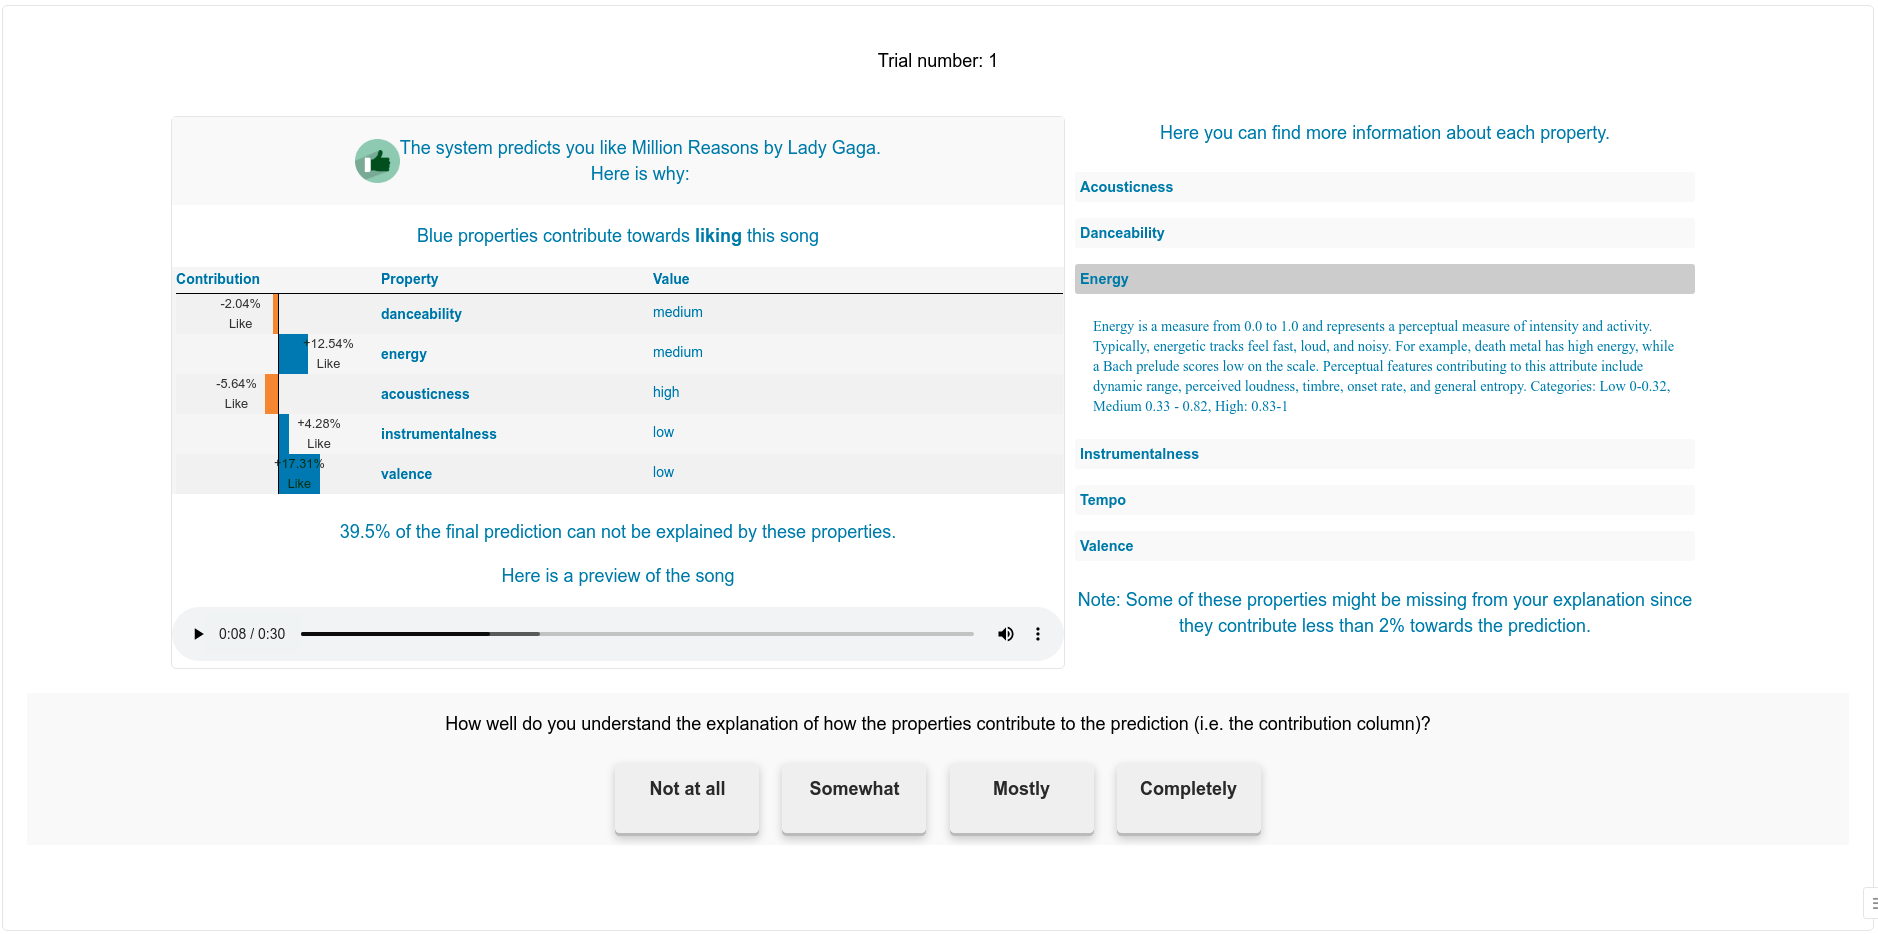
We started off by identifying the key variables and conditions related to framing that might influence user understanding (see image below). We wanted to test how 12 conditions (3x2x2) influenced user understanding. We did this for two application domains (music and loans) so we can identify if framing effects generalize across domains. Therefore, we trained an explainable music AI system and a loan decision support system in Python. The music AI system predicts and explains if participants like or dislike a song based on their favorite genre. The loan AI system predicts and explains loan eligibility or ineligibility for different user personas. With these systems, we created and conducted an online experiment. We initially did a pilot study to test if the user interaction and our user understanding questions could be improved. After the pilot, we deployed the main study and recruited participants through the university database. We determined the minimum number of participants through a power analysis.
Hypotheses
H1a: Feature explanations with underlying continuous variables will be easier to understand than explanations without underlying continuous variables.

H1b: Feature explanations with positive underlying continuous variables will be easier to understand than explanations with negative underlying continuous variables.

H2: Feature explanations with positively framed visualizations will be easier to understand than explanations with negatively framed visualizations.

H3: Feature explanations where the visualization framing and prediction are aligned will be easier to understand than explanations where the visualization framing and prediction are misaligned.
Six different conditions used to manipulate XAI visualizations

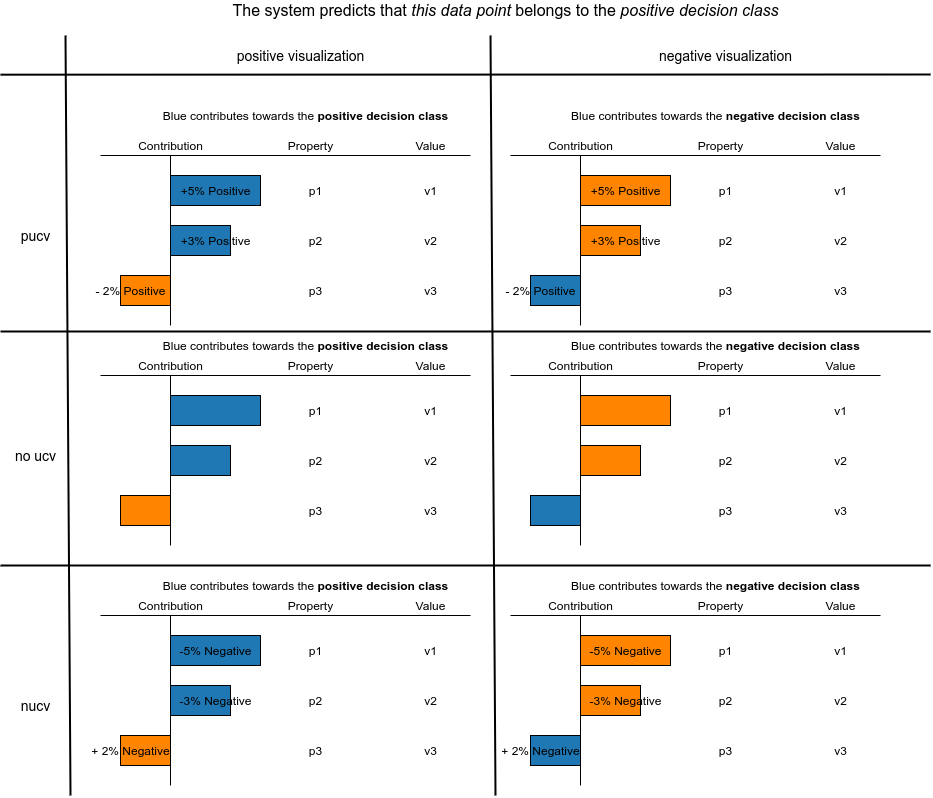
Our framing manipulations. We manipulated the UCV conditions (rows) between participants and the visualization (columns) within participants. For a negative prediction you have the same conditions. Therefore 12 conditions exist (6 for each predication class). pucv = positively framed UCVs; nucv = negatively framed UCVs
METHOD & ANALYSIS
Method
We conducted a mixed-design experiment. Between subjects, we manipulated the presentation of positive, negative and no UCVs. Within subjects, we manipulated the presentation of positively and negatively framed visualizations (N = 133). For each framing condition, we measured understandability and duration (the time it took to understand the explanation) over six trials. At the end of each condition, we also measured perceived understandability. Each condition was tested for our loan and music AI systems.
Main Result
To analyze the data, we used multi-level robust regression models in R. The main finding (below) was that positively framed UCVs were more understandable than negatively framed UCVs. We also found that positively framed visualizations were most understandable than negatively framed visualizations. When both these framing techniques were combined, we found that positively framed visualizations with positively framed UCVs were most understandable. Conversely, negatively framed visualizations with negative UCVs yielded the least understandable explanations.
Interaction between ucv framing and visualization framing XAI manipulations on understandability
pucv = positively framed UCVs; nucv = negatively framed UCVs
IMPACT & PRESENTATION
Impact
In the current state-of-the-art, we can already use XAI tools for explaining any machine learning model prediction. This study indicates that XAI tools are not always framed in a comprehensive manner which might demotivate people from using them. Comprehensibility can already be improved if such XAI tools are framed with respect to the positive decision class. Additionally, XAI tools can be restructured to contain positive UCVs. Furthermore, to aid other designers in re-framing explanations positively using XAI tools like LIME, we created the ArgueView Python package.
Defense
Full report
back to top
back to top