Improving the Experience of Meeting Faculty Members

Group Member
Project Overview
In our university faculty we observed that a lot of student-faculty interaction occurs in the classroom and many students don't take advantage of the possibility to meet faculty members outside these hours for questions, problems, or just a chat. Together with three other students we conducted qualitative studies to understand the current process of locating faculty members, analyzed affinity diagrams to find common themes, and iteratively created prototypes to improve the experience of student-faculty interactions. We found that the best solution for our faculty was to include walk-in hours for students along with a 'busy' button to indicate that faculty members don't want to be disturbed.
My Contribution
During ideation and affinity diagramming, I decided to take on the role of group leader since two of the group members were not familiar with doing qualitative research. This also meant that I was the one who was pushing ideas while the other members took more passive roles. However after this, I had to exit the group due to circumstances beyond my control. Once I got information that I could take part in the project, I tried to contribute more to make up for my lost time. In the design phase, we needed to provide rapid iterations and everyone had strong opinions about the design. Since discussions took very long I noticed that this could negatively affect our deadline. I decided to stop pushing my opinions and provided feasibility thoughts on each idea.
Design procedure for improving the student-faculty experience in our university
The project phases
IDEATE
Background
Previous research has shown that when the frequency of informal interactions between students and faculty members increases, there is an increase in personal, intellectual, and social outcomes for students. However, research also shows that students don't take advantage of informal interactions. We wanted to investigate how student faculty interaction currently takes place in our department to generate some insights.
Process
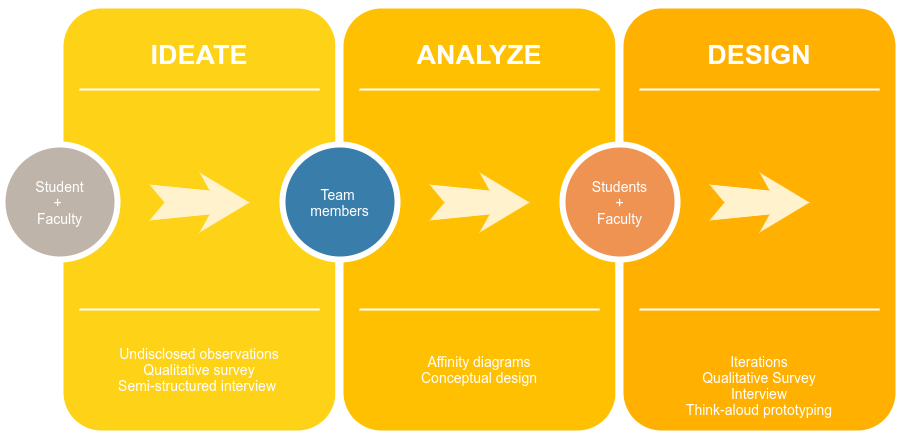
By looking at both, the student and faculty member perspective through various qualitative methods, we were able to triangulate our findings from both perspectives. For students, a combination of undisclosed observation and qualitative survey was used. The observation were carried out in our faculty building. During this process, we focused on the physical behavior of the students when they were looking for the faculty member. Furthermore, qualitative surveys were spread out via Google Form to students who have previously searched for faculty members in the IPO building. With these two methods, we can obtained data of both physical behavior (observation) and students’ thought process (qualitative survey) to help us better understand the current experience of locating faculty members. For faculty members, we conducted a semi-structured interview. These three methods were carried out in parallel, since they were independent of each other.
Diagram (left) of the observation area along with the flyers (right) that each partcipant received after being observed.
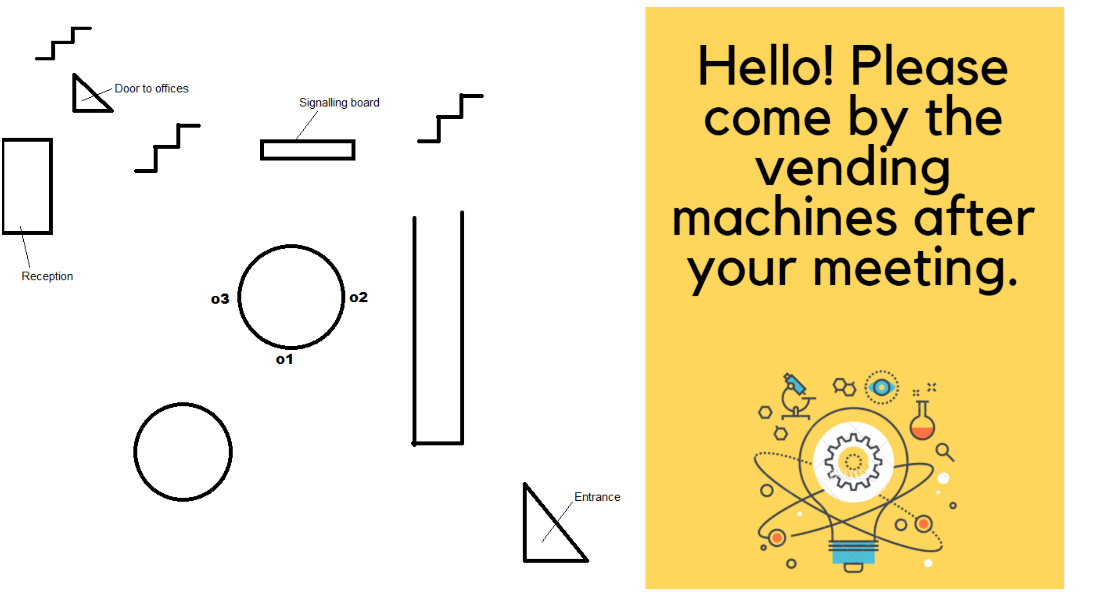
If a student looked like he/she was looking for a faculty member we pursued them until they reached their final location and gave them a flyer. The image shows the observation setting (left) and the flyers we gave students after observing them for interviews (right).
ANALYZE
Background
From the previous stage, both students and faculty members provided information that was key to our understanding of student-faculty member meetings outside of class hours. In this stage we used these insights to generate themes, analyze current problems and come up with a conceptual design.
Process
We started off by creating an affinity diagram and identifying themes. The three major themes were: signaling availability (how faculty members signal they are available to meet), scheduling meetings (where to meet, which medium is used to schedule the meeting), and wayfinding (where to go to meet a faculty member). We then looked at the problems in each of these themes. Although wayfinding was not ideal in the faculty building, the existing tools (light board showing faculty members’ office numbers and visual signs) allowed all of the students we observed and surveyed to find and arrive to the faculty member’s office they were looking for. Thus, for our design concept we decided to focus on tackling issues related to two of our themes: ‘signaling availability’ and ‘scheduling meetings’. To solve these problems we looked into three different solutions: remote real time availability and meeting requests, the implementation of office walk-in hours, and an automated light board.
Affinity diagram
DESIGN
Background
From our previous stage, we thought up of three conceptual design ideas: Setting up walk-in hours for faculty members, an availability and schedule meeting interface on each faculty members university page, and an automated physical light-board to signal availability of faculty members inside the building. In this stage we tested these ideas with students and faculty members over three different iterations and came up with a final design.
Process
For each iteration we used different research methods for faculty members and students.

Faculty Members:
For iteration 1 and 2, a qualitative survey was made using Google Forms. This survey included edited screenshots from the TU/e faculty member website and edited pictures from the light-board, to serve as a static prototype. For the third (and last) iteration, an interview was conducted with four faculty members. We talked to two PhD candidates and two associate professors, since we noticed that there were differences between these groups. The interviews lasted approximately 15 to 25 minutes.

Students:
Students were seated behind a laptop in one of the study rooms and given four scenarios in which they needed to meet with a fictive faculty member and think aloud while interacting with our prototype. In iteration 2 they were presented with two prototypes (the lightboard and the application created using Balsamiq Wireframe) while iteration 3 only provided the application prototype. The students were asked a few questions about their experience through a follow up interview.
We used the insights from our iterations to propose our final design solutions (below)
Final design solutions for improving student faculty interactions in our faculty.
After three iteration cycles, we found the following solutions to improve student-faculty interaction in our building
Ideation report
analysis report
Design report
back to top
back to top